You have 3 free guides left 😟
Unlock your guides5.2 The Phillips Curve
3 min read•june 18, 2024
Jeanne Stansak
Haseung Jun
Jeanne Stansak
Haseung Jun
Phillips Curve
The is a graph that shows how inflation rates and unemployment rates are related to each other, both in the short-run and long-run. It is actually just a reflection of the AD/AS graph. In the short-run, there is a between inflation and unemployment.
This graph deals with the twin evils (inflation and unemployment) continue to trade off. Unfortunately, we don't live in a perfect world, so we can never have inflation low and unemployment low at the same. When both are high, it's called , and it happens when the economy is (literally) on the verge of collapsing.
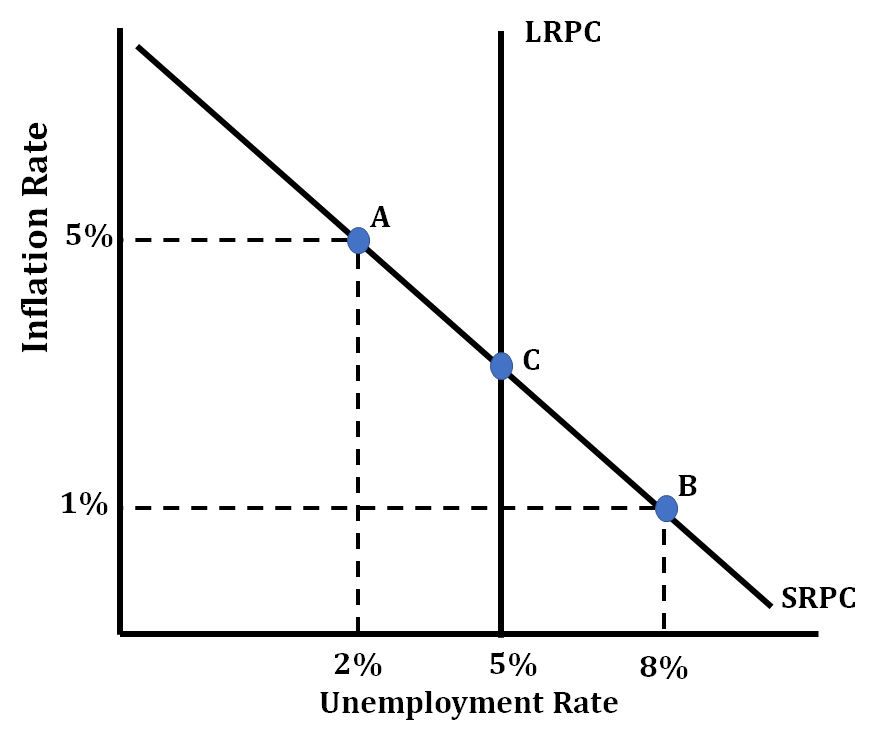
In the short run, inflation and unemployment have an inverse relationship. However, in the long run, unemployment will stay at a natural rate (reflecting the vertical nature of the long run Philips curve). The economy is always operating somewhere along the short-run Phillips curve, while in the long run, unemployment stays at a natural rate. Therefore, the long-run is the intersection of SRPC and LRPC.
The economy is always operating somewhere along the SRPC
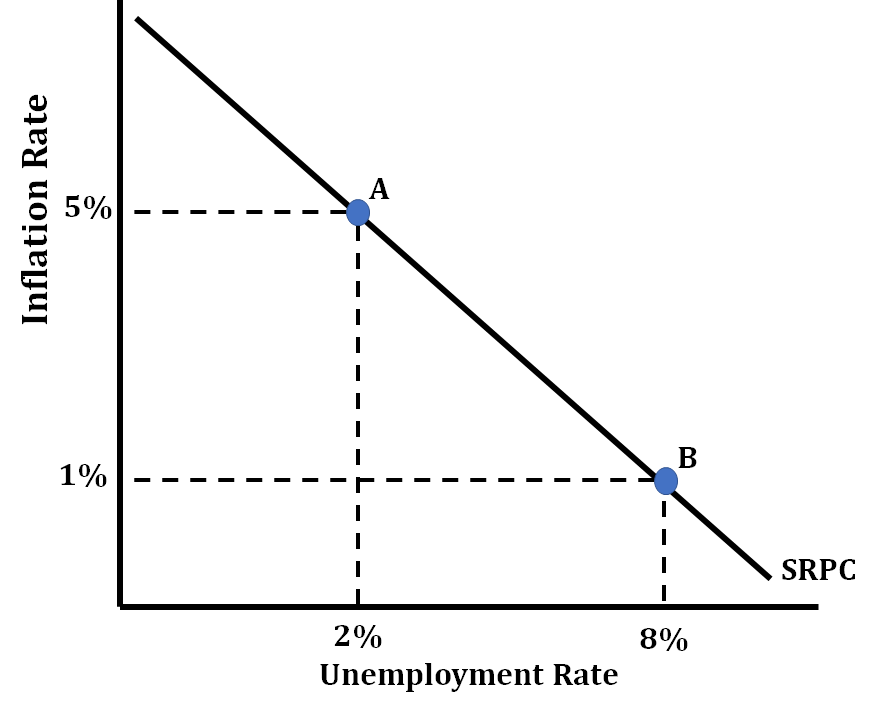
Inflation is low when unemployment is high because fewer people are working, and there is less demand for goods and services. As a result, prices don't rise as fast. When unemployment gets lower, inflation gets higher because so many more people have jobs and the money to spend on things. This means that there is a higher demand for goods and services, which increases prices.
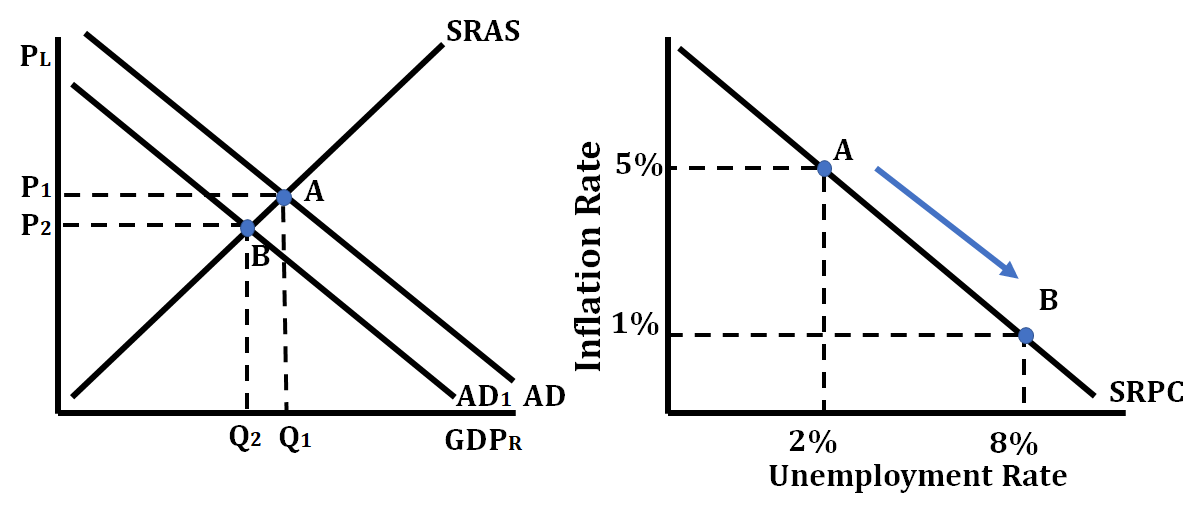
Shifting AD
The AS/AD graph and the Phillips curve have a lot in common. In the AS/AD graph, a decrease in AD causes a change in equilibrium from point A to point B. The same change in AD that causes the price level (PL) to fall and the to fall causes inflation to fall but unemployment to rise. This is mirrored on the short-run Phillips curve with a movement from point A to point B. See graph below.
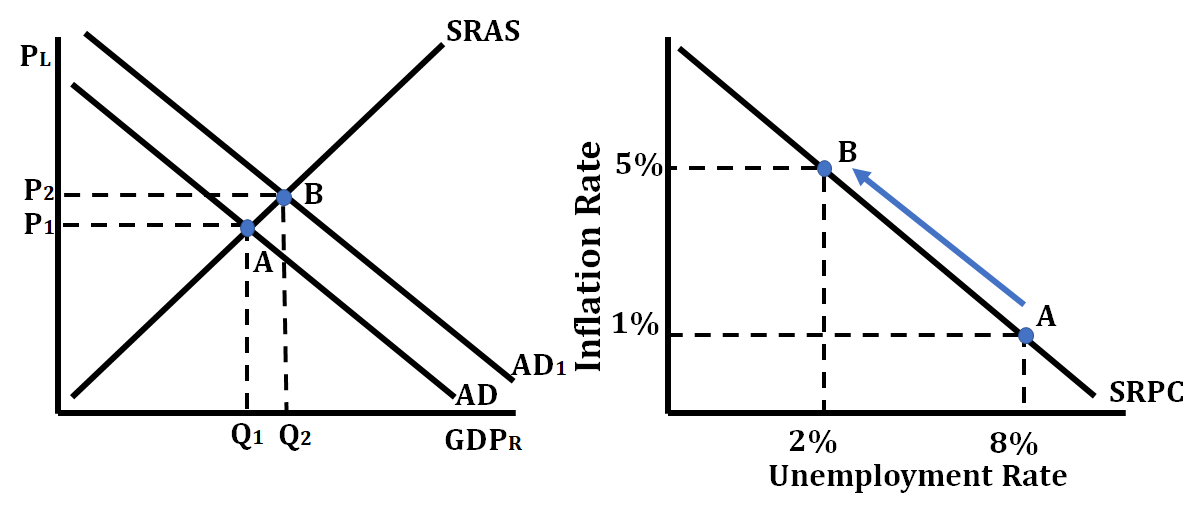
In the AS/AD graph, an increase in AD causes a change in equilibrium from point A to point B. The same change in AD that causes the price level (PL) to increase and the real GDP to increases causes inflation to rise but unemployment to fall. This is mirrored on the short-run Phillips curve with a movement from point A to point B.
Shifting SRAS
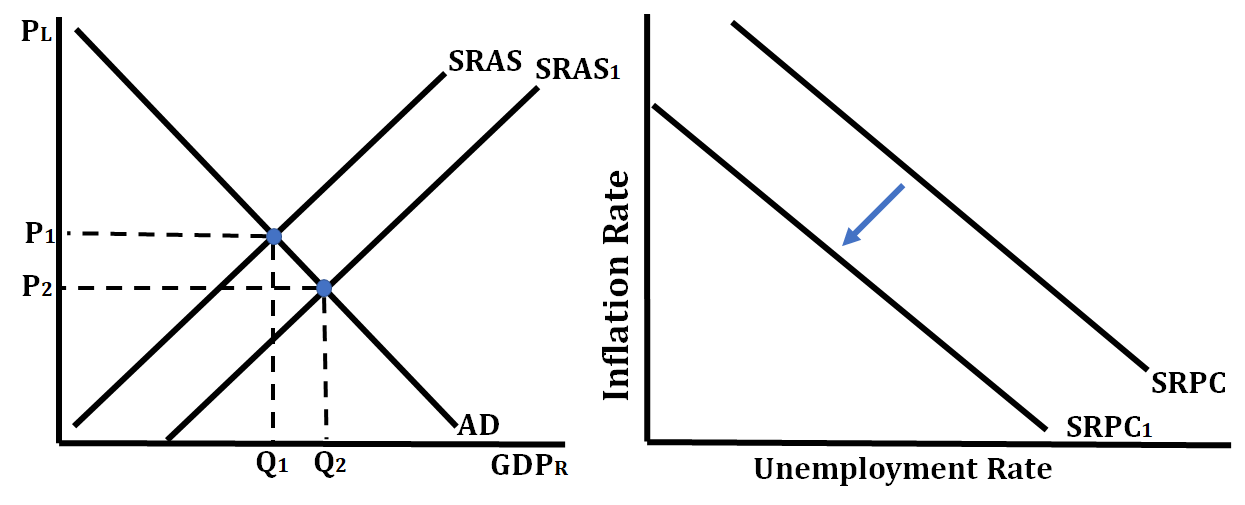
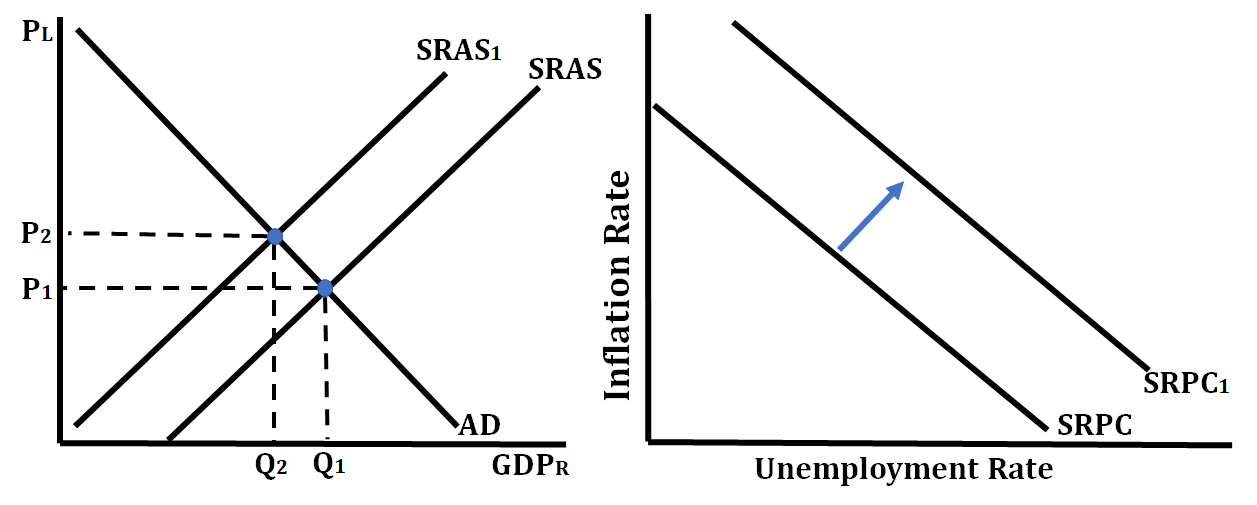
Whenever something makes the SRAS curve shift right or left, the shifts in the opposite direction. If the SRAS curve shifts right, the SRPC will shift left, causing price level (inflation) and unemployment to fall. However, if the SRAS curve shifts left, the SRPC will shift right, indicating stagflation because unemployment rate and inflation are both increasing.
In the case of the graph below, an increase in the SRAS curve, a shift to the right of this curve to SRAS1, will result in a leftward shift of the SRPC curve.
A decrease in the SRAS curve, a shift to the left of this curve, will result in a rightward shift of the SRPC curve.
Long-Run Philips Curve
The shows that, in the long-run, there is no trade-off between inflation and unemployment. The LRPC exists at an economy's , which just so happens to correspond to and the LRAS. The graph below shows an LRPC at the economy's natural rate of unemployment of 5%. When an economy's natural rate of unemployment changes, so does LRPC. The LRPC tells us that policies to change the level of employment in the economy will ultimately result in only changes in the inflation rate.