You have 3 free guides left 😟
Unlock your guides5.3 Perfectly Competitive Labor Markets
5 min read•june 18, 2024
Jeanne Stansak
dylan_black_2025
Jeanne Stansak
dylan_black_2025
Perfect Competition and Labor Markets
There are two types of . The first type is what is known as a perfectly competitive factor/resource market. There is significant use of labor as the type of factor (resource) in describing this type of factor market in AP Micro.
Characteristics of Perfectly Competitive Labor (Factor) Markets
Perfectly competitive labor (factor markets) are very similar the perfectly competitive market structure EXCEPT that we are dealing with resources instead of goods and services. Thus, everything is kinda backwards.
The characteristics of this type of factor (resource) market include:
-
Many, small firms hiring workers - like , which had many sellers, a perfectly competitive labor market has many buyers
-
Firms are "" - because there are many firms, one firm cannot set their wage higher or lower than the in the market, like how firms in perfect competition are "price takers".
-
Skill level of workers is identical (i.e. workers are perfect substitutes) - we assume this because our products are assumed to be homogenous in perfect competition. Since our workers are our "product," we assume homogeneity among each worker.
-
Firms can hire as many workers as they need or want at the wage set in the market
-
Firms will hire workers as long as MRP (marginal revenue product) > MRC (marginal resource cost) or until MRP = MRC. MRC = wage in this type of factor market. - this is the for a perfectly competitive labor market These probably sound pretty familiar, if not just an exact "flipped" version of perfect competition. This is because that's basically all it is!
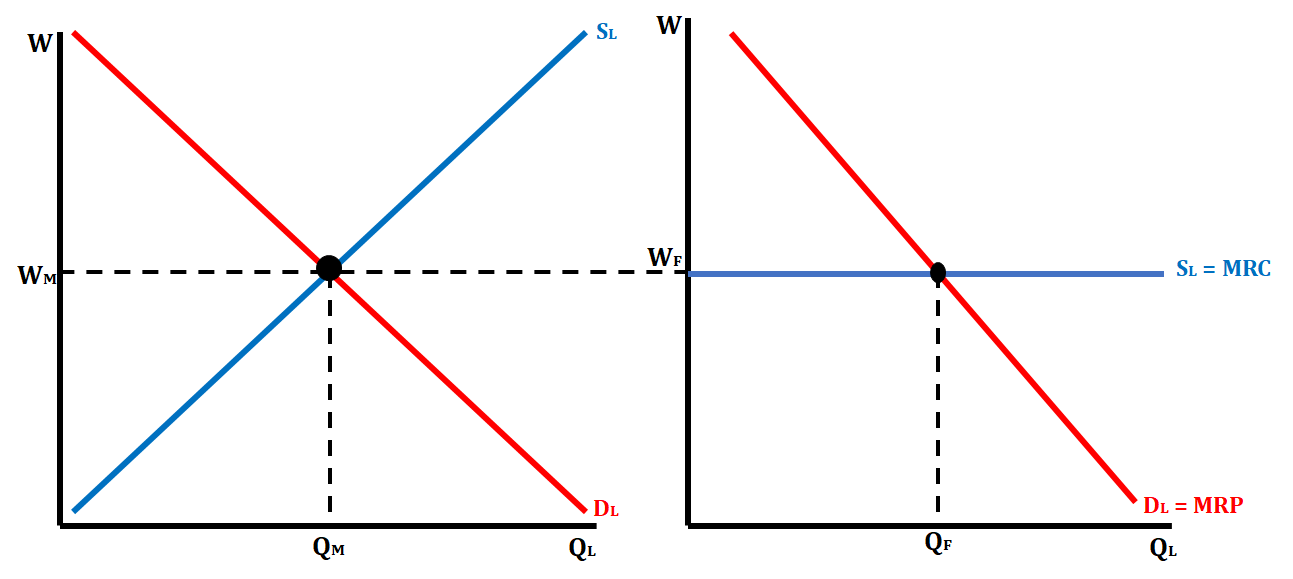
Perfectly Competitive Labor Market Graph
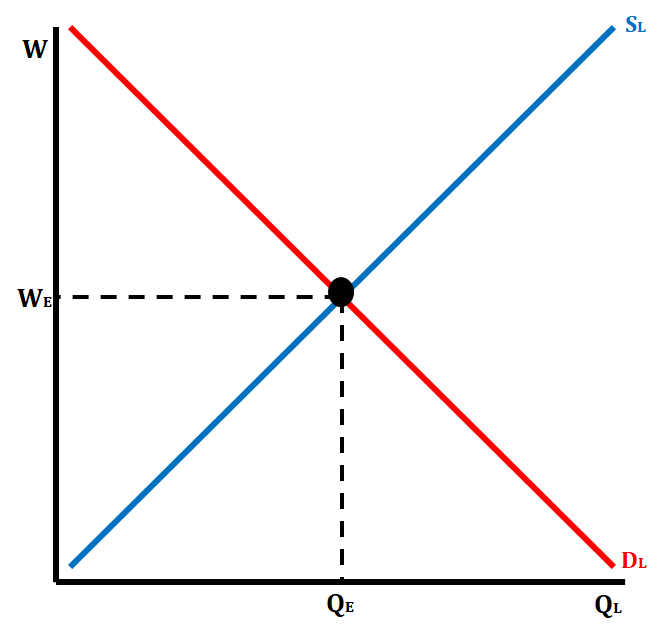
In the perfectly competitive labor market, there is a downward-sloping because of the . This means that each additional worker generates less revenue (MRP), and, therefore, is worth less to the firm. The for the labor market graph is upward-sloping because of the incentive to earn higher wages and greater income. If there are higher wages, it gives workers the incentive to give up leisure time and offer more of their time as workers. The same can be said for lower wages, which will deter workers from wanting to work more.
💡Notice that SL and DL are used to describe the supply and demand of labor. It is important to use the subscript L when you are drawing graphs.
The Firm Graph in a Perfectly Competitive Labor Market
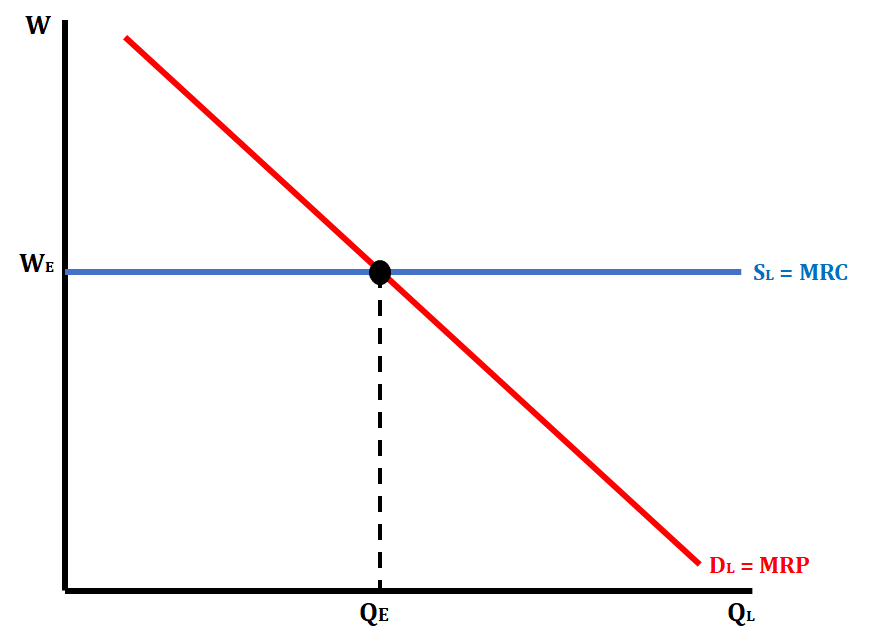
The perfect labor market firm graph looks a little different than it did in the product market. The demand for labor, otherwise known as MRP, is downward sloping. The supply of labor, otherwise known as MRC, is perfectly elastic. This shows that workers are wage takers and that firms hire all workers at the same wage level set by the market. The quantity of labor that each individual firm will hire is where MRC = MRP.
Side by Side Graphs in a Perfectly Labor Market
Just like in the product market, the perfectly labor market has side by side graphs that are drawn. The graph on the left shows the market graph and the graph on the right shows the firm graph.
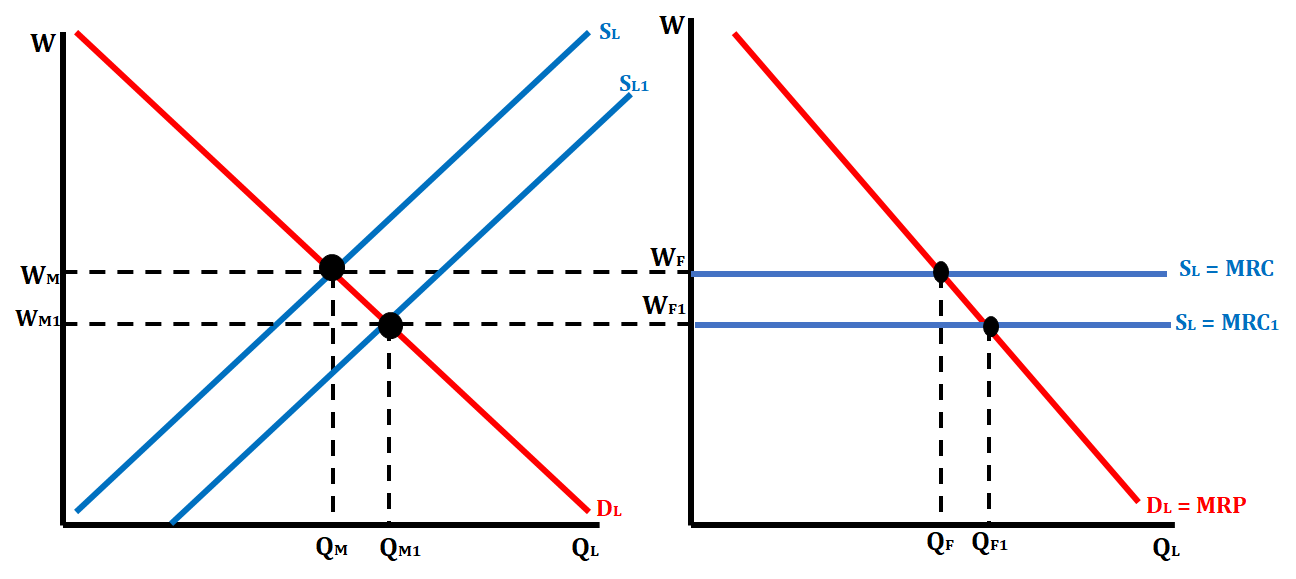
When there is a change in the market graph for either labor demand or labor supply, we have to show the corresponding changes in the firm graph. For example, if the supply of labor increases, that means the equilibrium wage will decrease. This will move the MRC curve in the firm graph down and increase the number of workers each firm will hire. The graph below illustrates this change.
Cost Minimizing Combination of Resources
During the production process, firms must be careful to choose a combination of resources that will minimize their costs. This is sometimes referred to as the Least-Cost Rule. In order for a firm to be using the combination of resources that will reduce its costs, they have to satisfy the following formula.
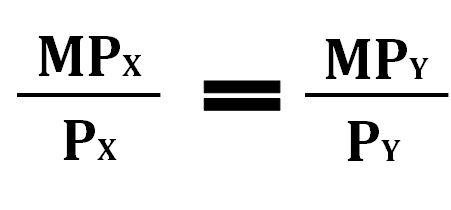
MP stands for marginal product and P stands for price. The x and y represent different resources.
This is similar to the utility maximization problem from unit 1, just flipped. Now instead of maximizing benefit, we minimize costs.
For those of you who want to look a little further: Do some research independently on and cost minimization. This is the fundamental theory behind how producers choose how to buy factors, though it's not needed for AP Micro
Let's look at an example with robots, a capital resource, and workers, labor resources. For this example, let's say the firm has a budget of 10 each and workers cost $5 each.
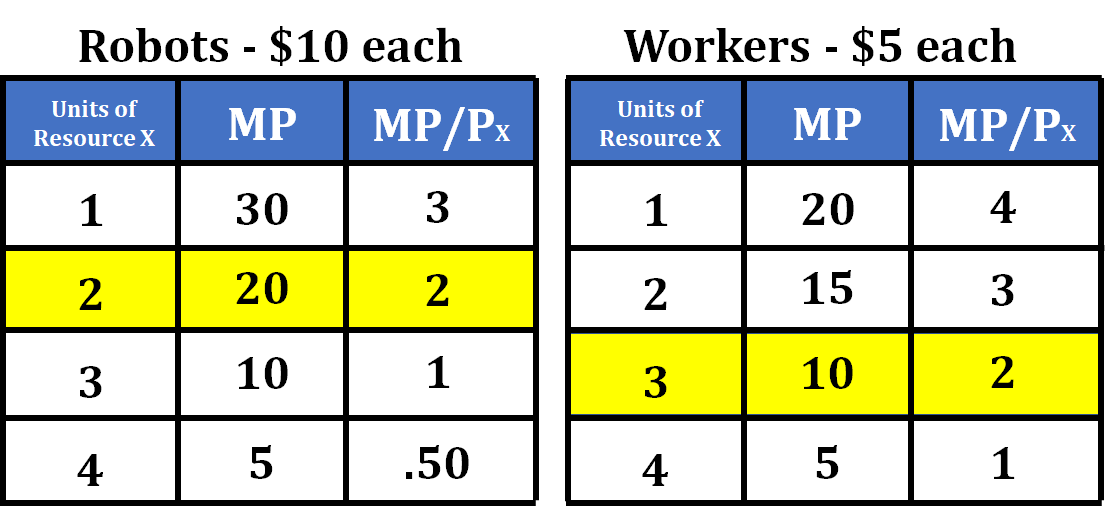
Steps for determining the least cost combination:
- The first step in determining the least cost combination is to decide what resources you are going to purchase. We always start with the resource that has the highest MP/P. In this case that is the first worker. When this firm purchases the first worker, we subtract 30 (5).
- They then move on to determine whether they should buy another worker or the first robot. Since the MP/P is the same for both these resources they will purchase a robot and a worker, which will cost them 15 (15).
- They then go on to the 3rd worker and the 2nd robot and see that the MP/P are identical here as well. They will again purchase both the worker and the robot, which will cost them 15-$15). The least-cost combination of this set of resources is 2 robots and 3 workers. We can see that the MP/P for both resources equal each other and stays within the firm's budget.
Profit-Maximizing Combination of Resources
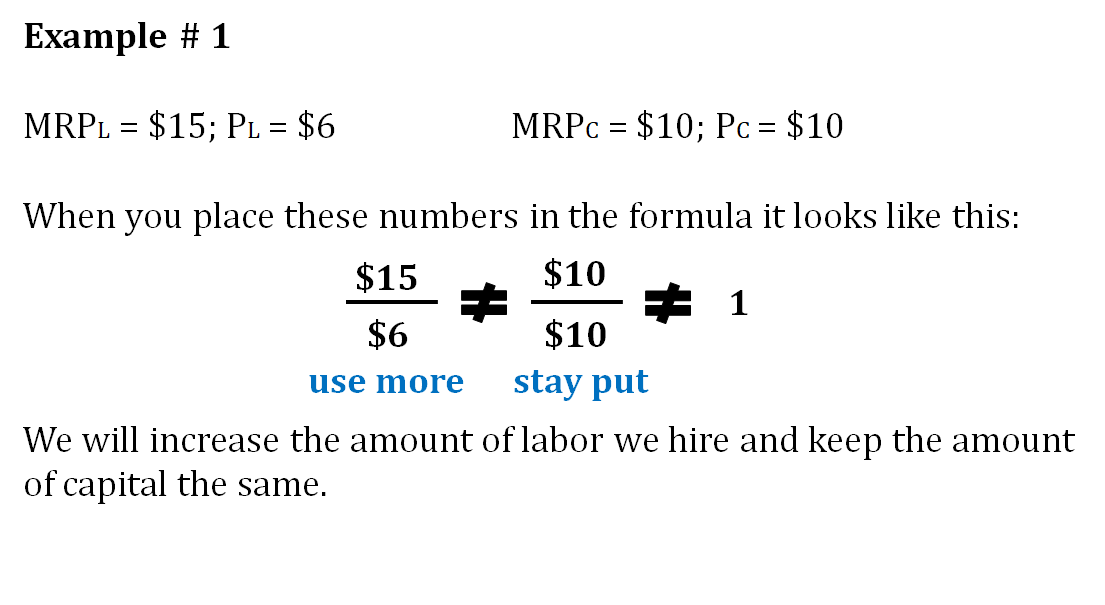
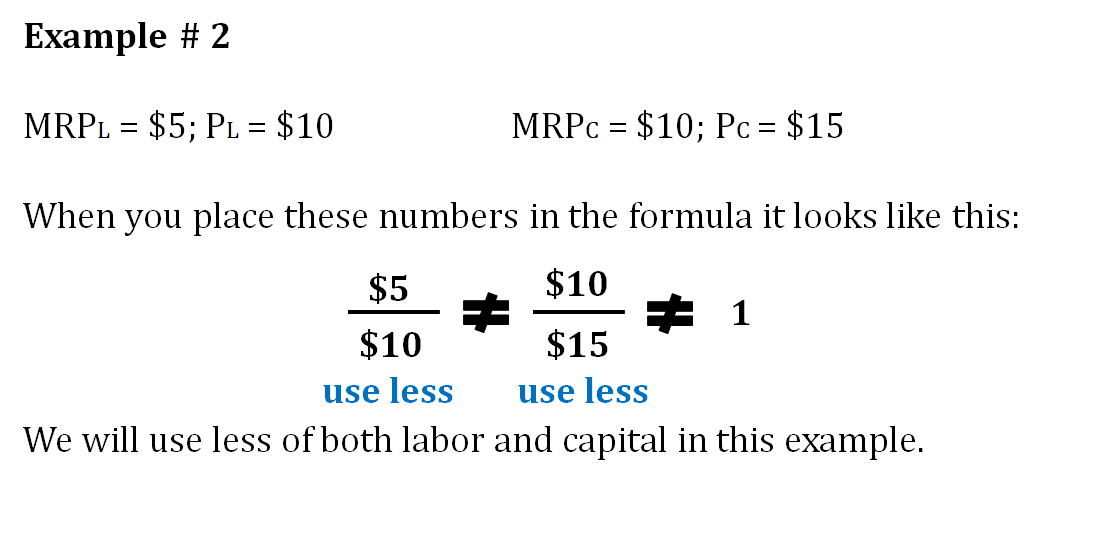
Another method that firms can look at when determining the combination of resources that they can use is what is known as the profit-maximizing rule for combining resources. In order to adhere to this rule, the firm must satisfy the following formula:
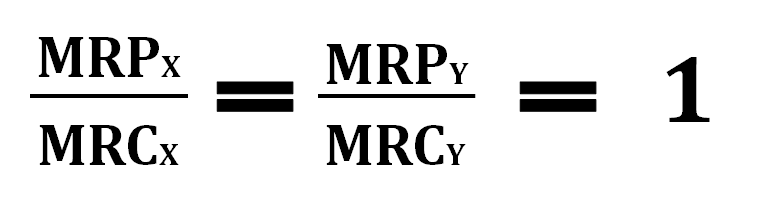
This means that the firm is hiring where MRP = MRC for each resource. If they are not currently at this particular point for each resource, they can either increase or decrease the number of resources they use to satisfy this formula and the rule. Let's look at a few examples: